Let's say you're analyzing an AB test with a test and control group.
1. How do you calculate the sample size necessary for an accurate measurement?
Answer:
https://blog.remesh.ai/how-to-calculate-sample-size
Five steps to finding your sample size
- Define population size or number of people
Your sample size needs will differ depending on the true population size or the total number of people you’re looking to conclude on. That’s why determining the minimum number of individuals required to represent your selection is an important first step.
- Designate your margin of error
- Determine your confidence level
- Predict expected variance
- Finalize your sample size
Two sample size calculations - one for the known population proportion and one for the unknown population.
Answer: sample size equation
sample size approx. 16* sigma^2 / delta^2
delta: the difference between control and treatment
Two sample t test : whether the difference is significant
Hypothesis: test mu c is the same as mu t
Alternative: mu c is not equal to mu t
Central limit theorem:
x bar approx. N(mu c - mut, 2sigma^2/n)
for simplicity, assume 2 population shared the same variance.
we now transform x bar to standard normal distribution
z = (xbar - (mu c - mut) )/ root 2 sigma / root n follows N(0,1)
Type II error rate (beta): P(accepting H0 when difference exists)
beta = P(acceptance of H0)
When accept H0, significance level is alpha
beta = P(|)<=Za/2)
mu c> mu t or mu c < mu t
assume mu c > mu t
Answer: optimizely
1)baseline conversion rate 10% (your control group's expected conversion rate; industry average;historical data)
2)minimum detectable effect 20% (minimum relative change in conversion rate you would like to be able to detect)
=> sample size goes up dramatically if the minimum detectable effect decreases
3)statistical significance 95% (95% is an accepted standard for statistical significance although it allows to set own threshold for significance based on your risk tolerance).
Answer: https://www.youtube.com/watch?v=vkE8sM8K794
Optimizely, VWO, crazyegg, AB Tasty; online sample calculators' programming languages
baseline conversion rate(existing conversion of your control or variation A before changes are made), minimum detectable effect(smallest change in conversion rate you are interested in detecting), statistical power (percentage of time the minimal effect will be detected if it exists), statistical significance (percentage of the time a difference will be detected, assuming one does not exist)
Minimal detectable effect over time: constrained for time and only run the test for a certain specific duration say 1 week. You want to see if it will be worthwhile to do the test, do so by calculating the MDE that you can reliably detect for different durations.
1 week 2 week, three weeks of running AB test, the minimum detectable effect will decrease.
every website/app has a business cycle - the time it typically takes for customers to make a convert
for example, it is possible for certain websites to have the number of conversions to be relatively low throughout the weekend, but then it peaks on weekdays. To get valid test data, you should run your test throughout the business cycle so that the data accounts for such potential fluctuations.
2. Let's say that the sample size is similar and sufficient between the two groups. In order to measure very small differences between the two, should the power get bigger or smaller?
Answer:
3. P-value?
The p-value (also known as Alpha) is the probability that our Null Hypothesis is true. Obtaining a significant result simply means the p-value obtained by your statistical test was equal to or less than your alpha, which in most cases is 0.05.
A p-value of 0.05 is a common standard used in many areas of research.
A significant p-value (ie. less than 0.05) would indicate that there is a less than 5% chance that your null hypothesis is correct. If this is the case, we reject the null hypothesis, accept our alternative hypothesis, and determine the student test scores are significantly different from each other.
4. Type 1 error (alpha) and Type 2 error (beta)

Power is defined as 1 — probability of type II error (β). In other words, it is the probability of detecting a difference between the groups when the difference actually exists (ie. the probability of correctly rejecting the null hypothesis). Therefore, as we increase the power of a statistical test we increase its ability to detect a significant (ie. p ≤ 0.05) difference between the groups.
It is generally accepted we should aim for a power of 0.8 or greater.
Then we will have an 80% chance of finding a statistically significant difference. That said, we still have a 20% chance of not being able to detect an actual significant difference between the groups.
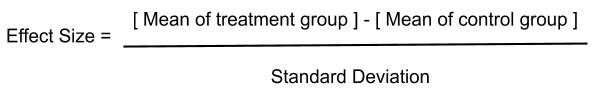
Effect size is typically expressed as Cohen’s d. Cohen described a small effect = 0.2, medium effect size = 0.5 and large effect size = 0.8
Smaller p-values (0.05 and below) don’t suggest the evidence of large or important effects, nor do high p-values (0.05+) imply insignificant importance and/or small effects. Given a large enough sample size, even very small effect sizes can produce significant p-values (0.05 and below). In other words, statistical significance explores the probability our results were due to chance and effect size explains the importance of our results.
'Coding 공부기록' 카테고리의 다른 글
| Top 8 Data Structures for Coding Interviews (0) | 2022.09.03 |
|---|---|
| Behavior Questions Preparation (~6/28) (0) | 2022.06.28 |
| [SQL]leetcode medium 뿌시기 (0) | 2021.11.01 |
| [SQL] Leetcode easy 문제 뿌시기 (0) | 2021.10.27 |
| [Product Sense] 채용공고를 기반으로 공부하기(1) - 토스(Toss) Data analyst (0) | 2021.10.27 |